

Strategic Indices
IPSC China Strategic Pressure Index
Indo-Pacific Studies Center | Strategic Intelligence Unit
Subscriber analytical update | April-May 2026
Subscriber-only data pack and interpretation based on the May 2026 index workbook.
The IPSC China Strategic Pressure Index tracks the cumulative build-up of China-related strategic pressure over time across multiple domains, rather than simply counting discrete incidents. It brings together structured signals from military activity, grey-zone operations, technology and digital ecosystems, financial and legal instruments, and political or elite-level signalling into a single running series. Steeper sections of the line indicate periods when pressure is compounding more rapidly.
UNCLASSIFIED | SUBSCRIBER RELEASE
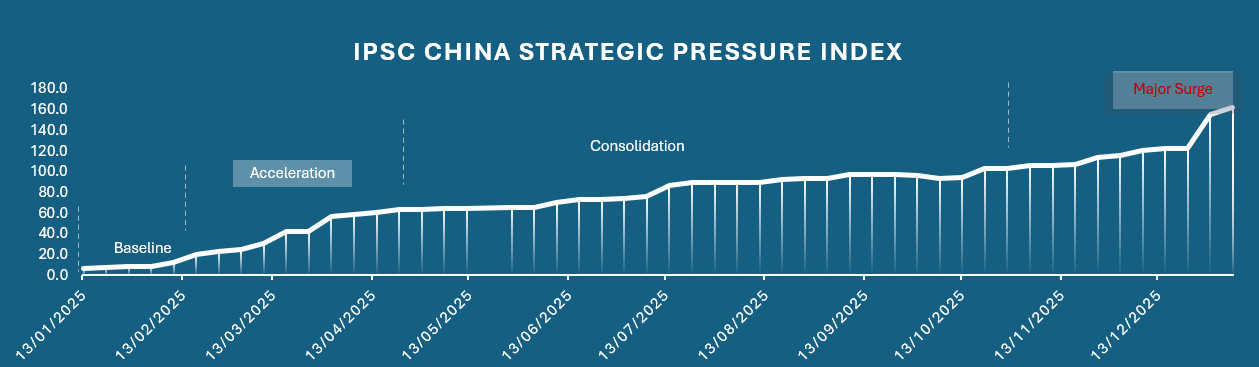
April-May 2026 shows a renewed steepening in the index. April was the sharper pressure month, driven by a concentrated military-operational surge around Taiwan, Luzon Strait, the South China Sea and the Western Pacific. May sustained the upward trajectory, but with fewer new signals and a stronger emphasis on Taiwan-linked political signalling, sanctions, espionage, coercive statecraft and post-Balikatan military activity.
Headline assessment
April accelerates; May consolidates at a higher pressure level
The cumulative index rose from 163.91 at the week starting 30 March 2026 to 229.32 at the week starting 27 April 2026, a gain of 65.40 points. In May, it rose again to 273.91 by the week starting 18 May 2026, before flattening through the week starting 25 May 2026.
The sequence should be read as a two-stage pressure cycle: an April operational spike, followed by a May consolidation phase in which pressure accumulated through political signalling, coercive statecraft and continued military posture rather than through the same density of new deployments.
Data pack
April event count
31 China RC01 signals
Signed impact: 51.71 | Absolute pressure: 61.24
May event count
23 China RC01 signals
Signed impact: 32.05 | Absolute pressure: 36.14
End-May index level
273.91
Flat through week starting 25 May 2026
What changed in April-May 2026
April 2026: operational pressure spike
- 31 China RC01 events
- Index gain: 65.40 points from late March to late April
- Dominant domains: Operational Incidents & Posture, Power Projection Capability, Force Design & Modernisation
- Core theatres: Taiwan approaches, Luzon Strait, Penghu, Kinmen, Pratas, Scarborough Shoal and the South China Sea
April's sharpest movement came during the week starting 20 April 2026, when the cumulative index moved from 180.18 to 217.77. The week captured a dense cluster of carrier, surface-group, coast guard, Taiwan Strait, Luzon Strait, South China Sea and strategic technology signals.
May 2026: consolidation and statecraft
- 23 China RC01 events
- Index gain: 44.60 points from late April to late May
- Dominant domain: Power Projection Capability
- Key signal types: Taiwan rhetoric, sanctions, espionage, coercive influence, research-vessel activity and post-Balikatan military posture
May did not reverse or normalize the pressure environment. It added fewer signals than April, but the signals were still strongly elevatory, particularly around Taiwan, U.S.-China bargaining, allied military posture and PRC-linked coercive statecraft.
April domain breakdown
- Operational Incidents & Posture: 11 events | 21.52 absolute pressure
- Power Projection Capability: 12 events | 25.20 absolute pressure
- Force Design & Modernisation: 8 events | 14.53 absolute pressure
May domain breakdown
- Power Projection Capability: 13 events | 23.48 absolute pressure
- Operational Incidents & Posture: 9 events | 11.56 absolute pressure
- Force Design & Modernisation: 1 event | 1.10 absolute pressure
April detail
April's pressure profile
April was the heavier month by both event volume and absolute pressure. The month was marked by operational compression across multiple maritime and air domains, with several high-weight signals clustered around the week starting 20 April 2026 and the week starting 27 April 2026.
- PLAN aircraft carrier Taiwan Strait transit.
- PLAN surface task group exercises east of Luzon Strait.
- Southern Theater Command activity during and after Balikatan 2026.
- PLAN surface combatants near Penghu Islands.
- Coast guard and maritime pressure around Kinmen, Pratas and Scarborough Shoal.
- Type 076 LHD South China Sea sea trials.
- LEO satellite constellation and military-network access signals.
- PRC sanctions on European firms linked to Taiwan arms sales.
The key analytical point is that April's index movement was not caused by one incident. It reflected a multi-node pressure environment: Taiwan, Luzon Strait, South China Sea, East China Sea approaches, coast guard activity, carrier posture, amphibious capability development, satellite-enabled force design and coercive diplomatic-economic measures all moved in the same direction.
May detail
May's pressure profile
May's index movement was smaller than April's, but it remained strongly accumulative. The month shifted from April's operational density toward Taiwan-linked political signalling, coercive statecraft and post-exercise military pressure. The highest-impact May signal was Xi's warning to Trump over Taiwan clash risk, weighted at 4.88.
- Xi warning Trump that Taiwan could trigger clash risk if handled poorly.
- PLA drills near Taiwan following the conclusion of Balikatan 2026.
- PRC research vessel Tongji conducting unauthorized hydrological survey activity near Taiwan.
- Taiwan HIMARS deployment to Penghu and Dongyin outlying islands.
- U.S. Treasury and State sanctions on PRC firms for Iran military support.
- PRC-linked espionage, foreign-agent and coercive influence cases.
- PLAN Western Pacific drills involving the Liaoning strike group.
The May pattern matters because it shows that pressure accumulation continued after the April operational spike. Instead of flattening, the index kept rising through a broader blend of rhetoric, legal exposure, sanctions, intelligence activity, Taiwan deterrence signals and continued military posture.
Taiwan Strait subset
Taiwan Strait pattern, April-May 2026
- April-May share of matched absolute pressure: 3.1%
- Matched signals: 1 event
- Dominant instrument: Naval surface activity
- Main domain: Operational Incidents & Posture
- Main event type: Escalatory
- Primary flags: WSA Escalation Index and WSA Capability Index
In the April-May 2026 update, the Taiwan Strait subset is narrower than in the full index series but strategically significant. The matched theatre signal is the PLAN aircraft carrier Taiwan Strait transit on 20 April 2026, coded as an escalatory naval-surface event with both escalation and capability flags.
The lower April-May theatre share does not mean the Strait was strategically quiet. Rather, much of the wider Taiwan pressure in this update appears through adjacent geographies and broader political-statecraft channels: Penghu, Kinmen, Pratas, Luzon Strait, Western Pacific drills, Taiwan-linked sanctions, HIMARS deployments, summit rhetoric and coercive influence activity. For subscribers, the key point is that Taiwan pressure in April-May was geographically distributed rather than confined to events coded only as Taiwan Strait.
Western Pacific subset
Western Pacific pattern, April-May 2026
- April-May share of matched absolute pressure: 2.6%
- Matched signals: 2 events
- Dominant instrument: Military
- Main domain: Force Design & Modernisation
- Main event type: Elevatory
- Primary flags: WSA Capability Index and RC05 Escalation Index
The Western Pacific subset in April-May 2026 is concentrated in force-design and naval-mobility signals. The two matched events are the PLAN Baotou-Huanggang transit near Amami Oshima on 19 April and Liaoning strike-group drills in the Western Pacific on 19 May.
This subset therefore captures the theatre-level mobility layer behind the broader Taiwan and Luzon Strait pressure picture. It is less about a dense volume of incidents and more about the normalisation of PLAN movement through Japan-adjacent approaches and into wider Western Pacific operating areas. For defence and alliance stakeholders, the signal is continued Chinese ability to connect Taiwan-relevant pressure with broader Western Pacific force posture.
Southeast Asia subset
Southeast Asia pattern, April-May 2026
- April-May share of matched absolute pressure: 0.0%
- Matched signals: 0 events coded directly to Southeast Asia
- Dominant instruments: No direct April-May matched subset signal
- Main domains: No direct April-May matched subset signal
- Main event types: No direct April-May matched subset signal
In the April-May 2026 update, Southeast Asia does not appear as a direct geography-coded driver in the matched China RC01 index rows. This is a notable change from the broader whole-series pattern, where Southeast Asia carries a more commercially distinctive profile through trade, finance, legal mechanisms, dependency mapping and grey-zone activity.
For this two-month subscriber update, Southeast Asia should therefore be read as an indirect exposure theatre rather than a direct driver. The operational pressure sits closer to the South China Sea, Luzon Strait and Philippines-linked exercise environment, while the older full-series Southeast Asia pattern remains relevant for structural leverage but is not the main source of April-May accumulation.
South China Sea subset
South China Sea pattern, April-May 2026
- April-May share of matched absolute pressure: 9.0%
- Matched signals: 6 events
- Dominant instruments: Military exercise / official statement, naval surface activity and naval deployment / capability testing
- Main domains: Power Projection Capability, Operational Incidents & Posture, Force Design & Modernisation
- Main event types: Escalatory and elevatory, with one routine capability signal
- Primary flags: WSA Escalation Index, WSA Capability Index and RC05 Escalation Index
The South China Sea is the most substantial of the four refreshed theatre subsets for April-May 2026. Its matched signals include PLA Southern Theater Command South China Sea exercise activity linked to Balikatan, South China Sea exercises linked to the Philippines, Type 076 LHD sea trials, and Liaoning movement toward the South China Sea.
The April-May South China Sea pattern is broader than a simple grey-zone harassment profile. It combines exercise signalling, naval surface activity, capability testing and force-design indicators. For maritime security analysts, this makes the subset a useful indicator of how China is using the South China Sea not only as a coercive operating area, but also as a staging and demonstration space for wider theatre pressure around the Philippines, Luzon Strait and Taiwan approaches.
Interpreting the slope
Phase reading of the April-May movement
The April-May period is best read as a renewed acceleration phase inside the broader 2025-2026 cumulative series. April represents the operational acceleration; May represents consolidation at a higher pressure baseline.
Pre-April level
Week starting 30 Mar 2026
Index level: 163.91
April acceleration
Week starting 27 Apr 2026
Index level: 229.32
May consolidation
Week starting 18 May 2026
Index level: 273.91
For subscribers, the operational implication is that the April-May sequence should not be treated as a single isolated incident cycle. It shows compounding pressure through posture, leverage and signalling: military deployments, grey-zone activity, technology enablers, sanctions, legal tools and elite-level statements all reinforced the upward line.
Subscriber interpretation
- April 2026 was the decisive acceleration month, adding 65.40 cumulative index points.
- May 2026 added a further 44.60 points before flattening late in the month.
- The April signal mix was more military-operational and theatre-focused.
- The May signal mix was more political, legal, intelligence and statecraft-focused.
- The Taiwan theatre remained central, but the pressure field extended through Luzon Strait, South China Sea, Western Pacific, East China Sea approaches and global coercive-statecraft channels.
- The two-month pattern shows pressure accumulating through both visible military posture and less visible leverage mechanisms.
For institutional users, the April-May update reinforces the value of monitoring cumulative pressure rather than discrete incident volume alone. The index line steepened because several categories of pressure were moving together, not because one event dominated the dataset.
Deeper analysis available
Institutional subscribers see the layers behind the line
Subscriber access adds the analytical layers behind the public chart: weekly surge charts, domain-specific indices, theatre-specific cuts, and event-type breakdowns distinguishing elevatory, escalatory, routine and de-escalatory signals.
IPSC's Strategic Intelligence Unit uses the same framework to produce decision-ready briefings, scenario notes, executive education and tailored risk indicators for institutional clients.
Request a strategic pressure briefing →Method and access
The index brings together structured signals from multiple domains and geographies into a running cumulative series. This subscriber update draws on the April-May 2026 China RC01 index rows and weekly cumulative pressure series.
The index is maintained by IPSC's Strategic Intelligence Unit using a consistent internal coding and review process.
IPSC can provide filtered indices, weekly surge charts, domain-specific breakdowns and tailored strategic briefings for institutional stakeholders.
Indo-Pacific Studies Center | IPSC Strategic Intelligence Unit
UNCLASSIFIED | SUBSCRIBER RELEASE